
Climate Group's pilot project with Climate TRACE has now been running for six months. The States and Regions Remote Sensing (STARRS) project is using satellite data to provide six Under2 Coalition members with up-to-date greenhouse gas emissions data.
So far, Climate TRACE has produced initial emissions estimates for key subsectors. Now, Climate TRACE and Climate Group are starting to collect and analyse findings from across participating states and regions.
Climate TRACE is using data from satellites, sensors on land, sea and in the sky, as well as from a number of other public and commercial sources to develop an emissions inventory for each Under2 Coalition member. This includes data on: energy (power, oil and gas); agriculture, forestry and other land use; industry (manufacturing), transport; waste and mineral extraction.
This is helping to build a detailed picture of where emissions are highest in each region and where there is the potential for high-impact action.
Why track emissions?
It’s incredibly difficult to reduce emissions without a clear picture of where they come from. Without accurate data, states and regions can't plan, deliver and track targeted mitigation action.
The Climate TRACE team is generating emissions estimates using a combination of satellite imaging and remote sensing data, which are processed using AI and machine learning technology to provide inputs into Climate TRACE’s mathematical models.
We've broken down the steps of this process to explain how the pilot has been progressing:
1) Detecting emissions hotspots
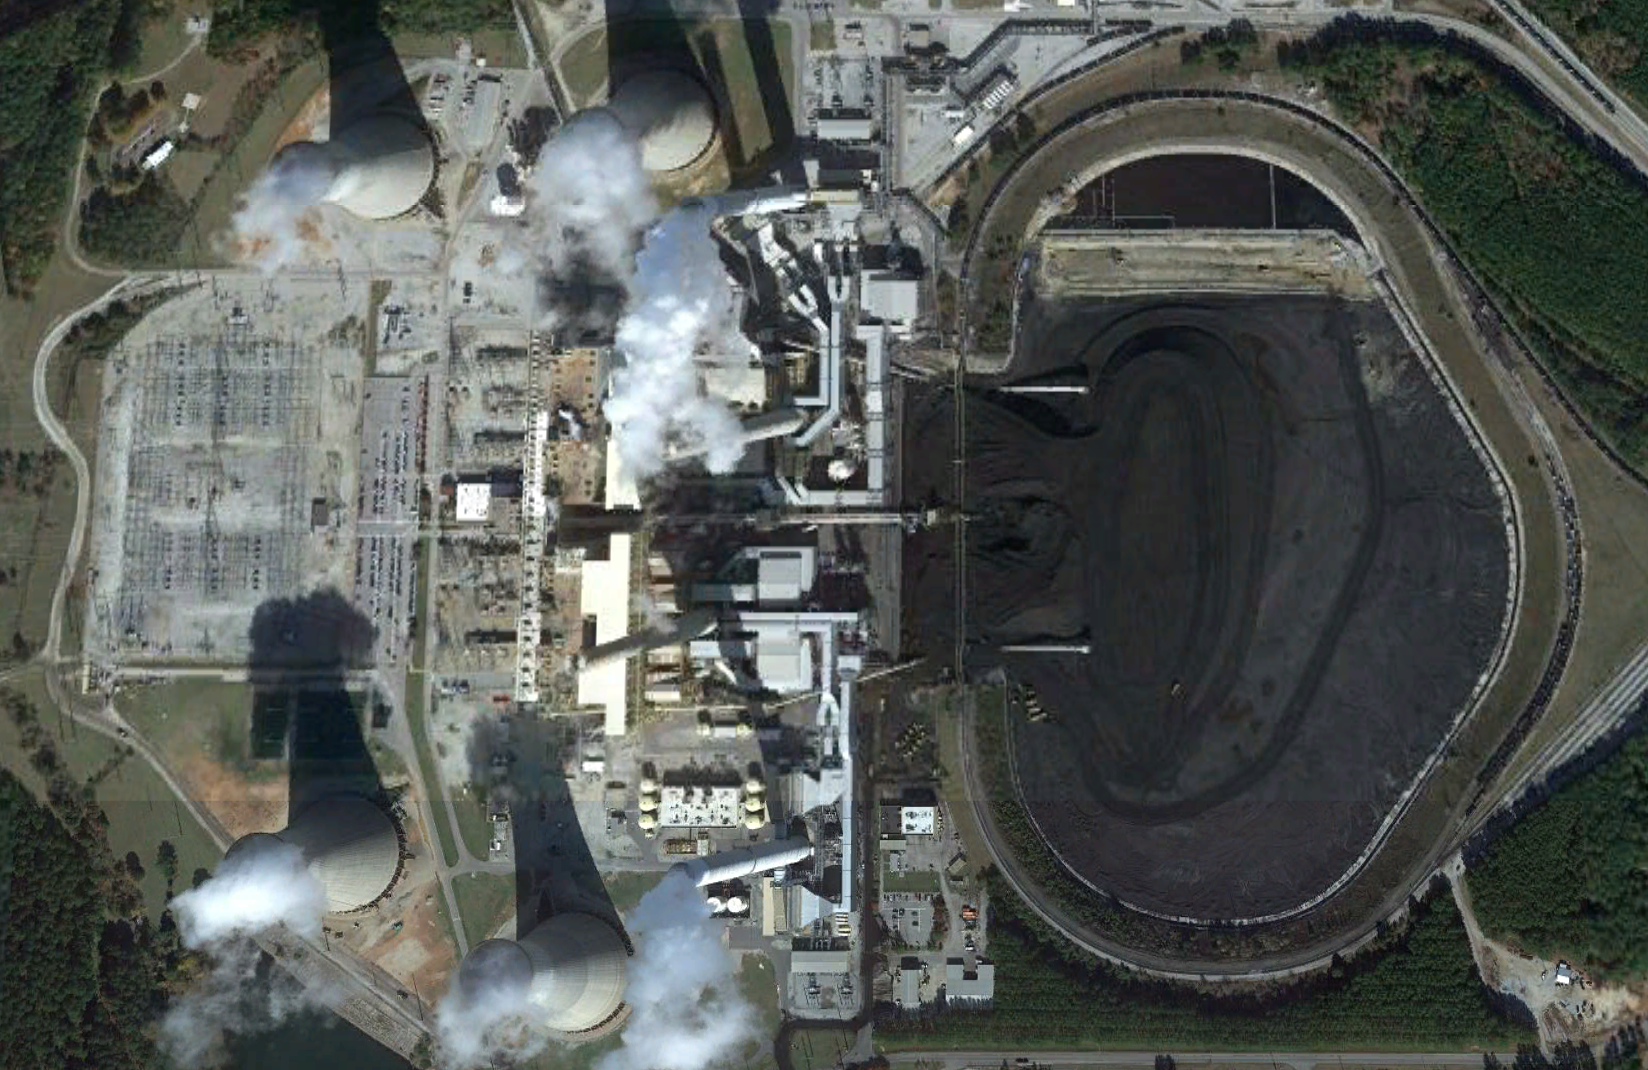
Satellites passing over Earth take snapshot images of the ground below.
Climate TRACE uses AI to detect emissions activities in these satellite images. Crucially, it covers emissions that are particularly hard to track, such as those that move (e.g. vehicles, ships, aeroplanes) and those that are not immediately obvious (e.g. landfill, livestock).
Example: Public satellites take a snapshot of an industrial steel plant on the ground below at a given moment in time.
2) It’s all in the algorithms
The next step is to quantify these 'snapshots' of emissions activity. And the way to do this lies in algorithms.
Sample data are used to train AI to spot indicators of GHG emissions in the satellite imagery. Climate TRACE then builds an algorithm — a problem-solving model — that learns from the data. It matches up known emissions-causing activity data to satellite imagery.
It’s developed using existing data which has been collected from ground- and sea-based physical emissions sensors, government datasets, and other sources. The data are then linked to records of when, where and how emissions came about in the past.
Example: AI algorithms are trained using ground truth data to recognise observable signals, e.g. steam plumes from the industrial steel plant, that are highly correlated with the release of emissions.
3) Validating the model
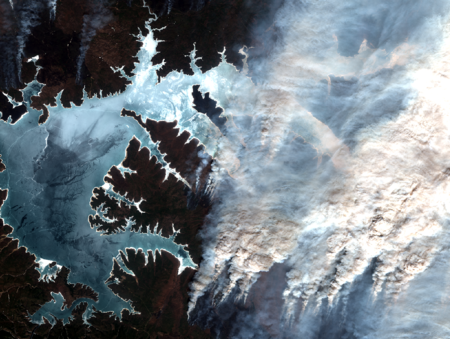
To increase the accuracy and granularity of the data, other datasets are used to validate the model. Specifically, Climate TRACE uses ground-truth GHG inventory data where available, i.e. data that’s been collected through direct observation or measurement, so it’s known to be real or true.
Remote sensing technologies, including satellites, provide a snapshot of emissions. Measurements depend on the frequency of satellite visits. So, for any emissions that vary throughout the day, such as power plants, factories, and vehicle fleets, we can only produce an estimate rather than a true measured value.
Incorporating bottom-up inventories helps to fill these gaps. They provide a baseline and account for long-term conditions and variations. However, in many cases, ground-truth data may not be available. In those cases, Climate TRACE employs a number of other methods, like comparing to inventories and non-emissions data (such as production estimates).
Example: Our pilot states and regions provide ground-truth data for the assets in their region to Climate TRACE. For example, they provided their most recent GHG inventories and associated metadata, as well as confirmed the presence of certain types of assets within their territories.
The outcome:
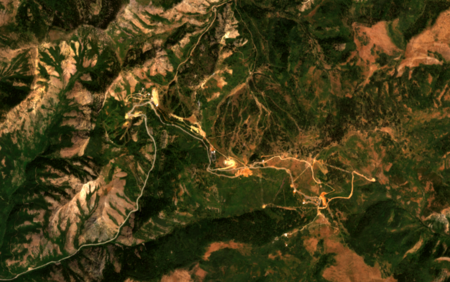
The Climate TRACE model is then used to estimate the amount of GHG emissions released by a given asset based on what the AI detects in satellite images. Estimating emissions from all detectable assets in a given geography allows Climate TRACE to generate emissions estimates for a whole state or region.
Combining multiple sources of information provides a detailed, independent look at global emissions that gets more granular over time.
With more and more information streaming in from space and sensors around the globe, Climate TRACE’s emissions estimates are continuously improving.
With more data, Climate TRACE can develop more sophisticated algorithms, and get better at finding and accurately measuring emissions.
This is vital for tackling emissions. We can only manage what we measure.
Example: Climate TRACE coalition member TransitionZero provides estimates for the annual emissions from 2015 - 2020 of all known steel plants within each of our pilot regions. Together with Climate Group, these data are aggregated to provide estimates of total annual emissions from the steel production subsector in the region. It can be combined with emissions estimates from other industrial activities in the region to provide emissions estimates for the whole industrial sector in that region.
Now you have the data, what comes next?
We have successfully collected emissions data for six members of the Under2 Coalition and are analysing this to understand the broad picture across states as well as where we still have gaps.
After this we will be discussing the data in depth with each state or region to match it up with their knowledge and experience. This will give context to our findings and help us to benchmark one sector against another in terms of their emissions.
Once this has happened we will be ready for the next step: introducing measures to reduce emissions in the most polluting sectors and finding solutions that are appropriate to each state or region. We hope this will be the beginning of a much bigger piece of work that can be rolled out across our membership in years to come as we work together to become a net zero coalition by 2050.